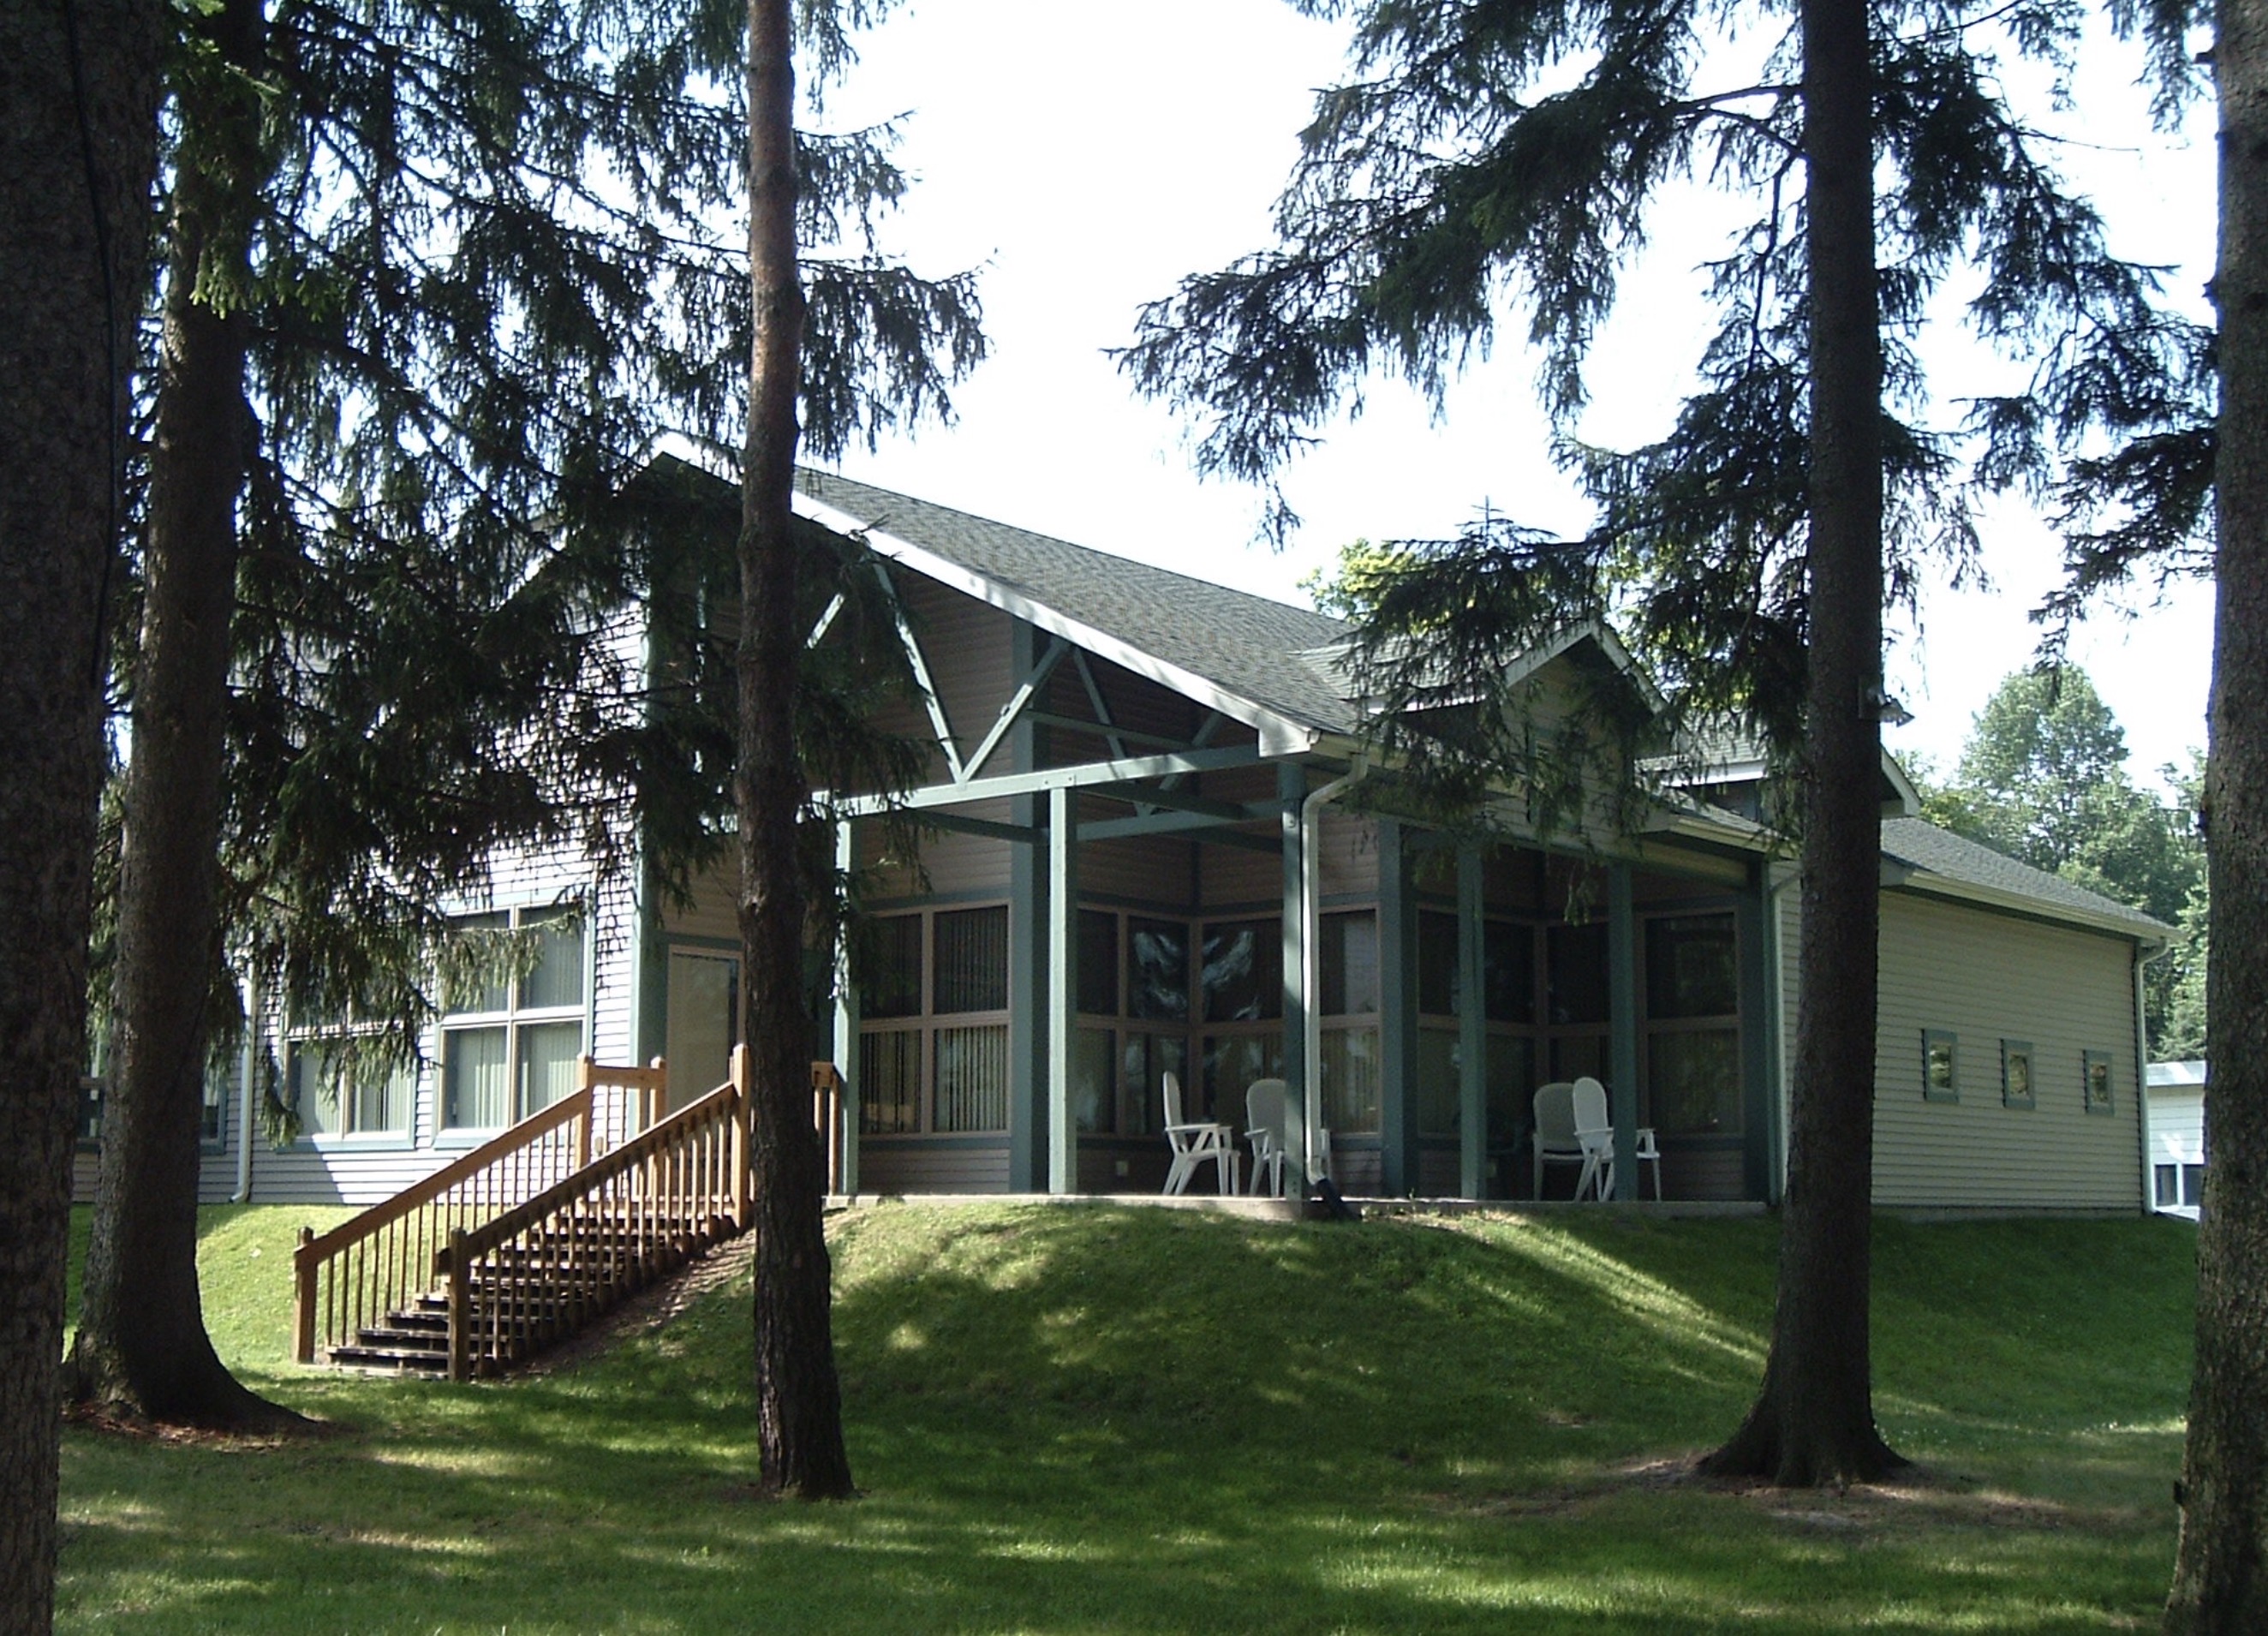
The University of Scranton has been able to call itself one of the “Top Five in the North” since 2022, until this year’s release of the US News 2025 Guidebook, which ranked the University as sixth instead. This ranking marks the 31st consecutive year in the top ten of “Regional Universities: North,” which is certainly an accomplishment, but the loss of the fifth place slot to St Joseph’s University in Philadelphia—quite the climb from their eighth place holding last year—begs the question “What changed?” and perhaps “What did we do wrong?”
First, it’s important to address the US News’ “methodology,” or how they decided what makes universities the “best.” For their 2025 Guidebook, which publishes university statistics and rankings to help incoming college applicants, US News focused on a host of different data sets and surveys for ranking Regional Universities, or universities who “offer a broad scope of undergraduate degrees and some master's degree programs but few, if any, doctoral programs” and which are divided into geographic groups of North (this is the region The University of Scranton is ranked among), South, Midwest, and West. To look for areas for improvement, we can look at the main categories weighted in US News’ rankings.
The most heavily weighted category (20%) considered in forming the rankings was “peer assessment.” These assessments consisted of sending surveys to academics at universities such as “presidents, provosts, and deans of admissions” who would then score their peer institutions from one to five. These scores are based on an institution’s academic reputation, and the answers are private, only available through subscription, so the only opportunity for improvement is to continue to advocate for programs that build our repute.
Graduation rates are the next highest weighted category (16%) considered in rankings. US News uses six-year graduation rates for bachelor’s programs but averages those of the past four years. This means that the graduation rate is based on the entering classes from 2014 to 2017. According to US News, for the University of Scranton, the six-year graduation rate is 81%, and for Saint Joseph’s University it is 80%. Not a huge difference, but still a difference in one percentage point.
The next most weighted category (ten percent) is “graduation rate performance.” This is also an average of the four most recent years’ data, and simply is a measurement of how much a “school's actual graduation rate exceeded its predicted graduation rate,” the predictions having been made by US News previously. This data is not available without subscription.
Next weighted: faculty and financial resources, both at eight percent. “Faculty resources” includes faculty salaries, student-to-faculty ratio, and full-time faculty. Using data from the American Association of University Professors 2024 data, Saint Joseph’s average faculty salaries generally exceeded ours, though it might be worthy to note that Saint Joseph’s did not include non-tenured faculty in the data they released to the association. According to the Common Data Sets, Saint Joseph University’s student-to-faculty ratio is 10:1, with the University of Scranton’s is just behind at 13:1, and in the 2023-2024 academic year our full-time faculty numbered 274 compared to Saint Joseph’s 363. “Financial resources” consists of an institution's expenditures on instruction and academics, based on IPEDS (Integrated Postsecondary Education Data System) data from the 2022 fiscal year. The University of Scranton spent $14,303 per FTE (full-time equivalent) enrollment on instruction compared to Saint Joseph’s $13,025. For research expenses, the numbers are $246 and $1,209, respectively; for $4,918 and $8,107, respectively. For “institutional support,” our $5,908 is exceeded by Saint Joseph’s $9,459. These differences in faculty resources and financial discrepancies in academics could certainly be something to consider in later years.
Pell graduation rates in addition to Pell graduation performance were both weighted at 5.5%, creating a “social mobility” category weighted 11%. The closer a school’s rates (calculated alike to total graduation rates and performance) for Pell Grant recipients are to non-recipients, the better a school’s “score” in these categories. This year, the six-year graduation rate for Pell recipients is 73%, compared to 83% for non-recipients, at the University of Scranton. At Saint Joseph’s University, those numbers are 74% and 82%, respectively. It’s worthy to note that this doesn’t include the other three years (entering classes Fall 2014-16) the US News considered in their rating. Also, US News adjusts ratings based on the proportion of Pell-eligible students enrolled to a university in the first place: in the entering class of 2017 that was about 18.9% of students at the University of Scranton versus about 15.8% at Saint Joseph’s University. Another important note is that in previous years, US News considered first generation college students' performance as part of “social mobility,” this year, that factor was removed from rankings. The University of Scranton makes a lot of effort on behalf of our first-generation students, so losing that qualifier likely had an effect on the rankings.
The remaining factors were weighted by US News at 5% or less, and include first-year retention rates, borrower debt, and standardized test scores. More information can be found on the US News website, but may cost money to access. Some data is free through the Common Data Set and IPEDS surveys.
Remember, an arbitrary ranking does not truly define our university or the students who attend it—although congratulations to a fellow champion of the Jesuit education for achieving top five status nonetheless! We can take this ranking as an opportunity to embody the Jesuit value of striving for excellence in all things; our community improves when our members do not fear advocacy. Top five is waiting for us next year!
CAPTION: Regional Universities that the University of Scranton is ranked alongside are located in what US News considers the “North,” shown in red. (Photo courtesy of US News.)


.jpeg)